The 2025 U.S. Real-Estate Risk Map reveals growing threats to home values, including climate exposure, insurance withdrawal, migration loss, affordability pressure, and shifting employment patterns. While some zip codes face long-term declines, others are poised for rapid appreciation. This in-depth guide explains which areas are at risk, which are safe, and what homeowners and buyers can do to protect themselves.
Introduction: Why the 2025 Housing Landscape Looks Unlike Any Before It
For decades, real estate moved predictably—expanding suburbs, stable coastal demand, and consistent appreciation. But by 2025, that stability has fractured. Climate threats, insurance instability, demographic shifts, and affordability crises are reshaping housing markets zip code by zip code.
Industry reports from Redfin, CoreLogic, FEMA, and Freddie Mac increasingly warn that millions of American homes now sit in “structurally vulnerable” zip codes—areas where long-term value may plateau or decline.
At the same time, other regions are booming, driven by inbound migration, low taxes, strong job markets, and low climate risk.
This article breaks down the 2025 Real-Estate Risk Map, revealing which zip codes are most vulnerable—and which ones could become the next American hotspots.
Why Are Some Zip Codes Now Considered “Doomed”?
The term “doomed” refers not to permanent collapse, but to long-term structural risk that suppresses or reverses home-value appreciation. These risks go beyond market cycles and interest rates.
Here are the five main factors shaping real estate risk in 2025.
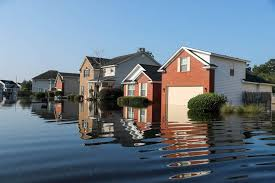
1. Climate Risk (Floods, Fires, Heat, Hurricanes)
Climate risk is now one of the largest predictors of long-term home value.
According to First Street Foundation:
- 31 million U.S. homes face rising flood or fire exposure
- Climate disasters now cost the U.S. over $165 billion annually
- Many flood-zone maps underestimate risk
Coastal Florida, coastal Texas, Louisiana, and California wildfire areas top the danger list.
Real Example
A homeowner in Fort Myers saw their flood insurance premium jump from $1,400 to $7,900 after new risk modeling. Their home value has stalled despite continued demand in nearby areas.
2. Insurance Risk (Carrier Withdrawal + Premium Shock)
In states like California, Florida, and Louisiana, major insurers have reduced coverage or left entirely.
Insurance premiums in some zip codes have risen:
- 30% to 120% within a few years
- Some carriers doubled deductibles
- Some homes are now “functionally uninsurable”
A home without insurance financing becomes unsellable to nearly all buyers—destroying value.
Real Example
In California’s wildfire corridor, a family saw premiums go from $2,700 to $9,800 in four years. Nearby homes experienced up to 40% price declines after losing major insurers.
3. Migration Risk (Population Decline)
U.S. Census data confirms ongoing outbound migration in major metros:
- New York: 600,000+ lost since 2020
- Illinois: 340,000+ lost
- New Jersey: 121,000+ lost
- California: 850,000+ lost
Zip codes in these states may see slower appreciation due to shrinking demand.
4. Affordability Risk (Cost + Taxes + Insurance)
The National Association of Realtors reports the lowest housing affordability levels in 38 years.
Zip codes with:
- High property taxes
- Rapidly rising HOA fees
- Premium shocks
- Stagnant wages
are especially vulnerable.
5. Employment Risk (Local Economic Shifts)
Zip codes tied to declining industries (manufacturing towns) or dependent on single employers face the greatest economic vulnerability.
Examples include parts of the Rust Belt, small Midwest towns, and regions with declining tech investment.
Which Zip Codes Appear Most at Risk on the 2025 U.S. Real-Estate Map?
Based on multi-source data (FEMA, Redfin, NAR, state insurance regulators), these categories of zip codes show the highest risk levels.
1. Florida Coastal Zip Codes (Insurance + Climate Crisis)
Areas most at risk:
- Miami-Dade (33139, 33141, 33154)
- Tampa Bay (33606, 33707)
- Daytona & Cape Canaveral (32114, 32920)
- Fort Myers & Naples coastal zones
High hurricane exposure + insurance collapse = multi-layered risk.
Real Example:
A Pinellas County home once valued at $740,000 sat unsold for 140+ days after flood reclassification raised annual premiums by $6,000.
2. California Wildfire + Insurance Risk Zip Codes
Vulnerable areas:
- Sonoma (95476, 95492)
- Napa Valley foothills
- Sacramento canyon areas
- Los Angeles canyon communities
Insurance withdrawal is the #1 destabilizing factor.
3. Northeast & Midwest Population-Loss Zip Codes
Regions with consistent outbound migration:
- Chicago’s Cook County (60617, 60628)
- New York’s Bronx & Queens
- New Jersey’s urban corridor (07104, 07087)
- Philadelphia outskirts
Declining population = declining buyer demand = declining values.
4. Rust Belt Economic-Decline Zip Codes
High-risk zones include:
- Cleveland’s east side
- Detroit’s older manufacturing-heavy regions
- Youngstown & Akron
- Rochester & Syracuse
These areas struggle with aging infrastructure + slow job growth.
5. Southwest Zip Codes Facing Water Scarcity
Arizona, Nevada, and Utah zip codes dependent on the Colorado River face future scarcity pricing, which may impact long-term values.
Example risk areas:
- Phoenix outskirts (85086, 85331)
- Las Vegas valley fringe zones (89011, 89166)
Which Zip Codes Are Safest—or Poised to Boom—in 2025?
It’s not all doom.
Some states contain zip codes with extremely strong long-term potential driven by:
- Low climate risk
- Job growth
- Low taxes
- Strong migration inflow
- Affordable housing
1. Tennessee (Nashville, Knoxville, Chattanooga)
Strong performers include:
- 37067 (Franklin)
- 37934 (Farragut)
- 37421 (East Brainerd)
Why? No income tax, booming job growth, stable insurance markets.
2. North Carolina (Charlotte & Raleigh Metros)
High-growth zip codes include:
- 28277 (Ballantyne)
- 27614 (North Raleigh)
- 27560 (Morrisville)
Booming tech, biotech, and finance industries drive demand.
3. Texas (Inland Metros: Austin, Dallas, Houston)
Strong zip codes include:
- 78641 (Leander)
- 75070 (McKinney)
- 77095 (Cypress area)
Affordable homes + expanding employment hubs = safe long-term bet.
4. Utah & Idaho (Salt Lake City & Boise Metros)
Growth-ready zip codes:
- 84047 (Herriman)
- 84121 (Cottonwood Heights)
- 83709 (Boise)
Young populations + strong economies = consistent value growth.
5. Midwest Stability Markets
These undervalued but stable metro zones include:
- Columbus OH
- Indianapolis IN
- Kansas City MO
Low cost + low risk = strong investor appeal.
Is Your Zip Code Doomed? Key Warning Signs
Look for these red flags:
High-Risk Indicators
- Insurance increases of 30%+ yearly
- Multiple insurers exiting the region
- Population decline for 3+ years
- Homes taking longer to sell
- Falling school enrollment
- Major employers downsizing
- Repeated natural disasters
Low-Risk Indicators
- Rapid inbound migration
- Schools expanding capacity
- Strong job growth
- New construction
- Multiple insurers offering stable rates
What Should Homeowners Do if Their Zip Code Appears High-Risk?
Smart Homeowner Moves
- Compare insurance carriers annually
- Check FEMA flood/fire maps every year
- Monitor local job growth
- Track migration patterns
- Prioritize home upgrades that boost resilience (roofing, windows, drainage)
When to Consider Selling
- Insurance becomes unaffordable
- Local employers leave
- Property values plateau
- Buyers begin negotiating aggressively
What Buyers Should Do in 2025
Best Strategies
- Favor low-climate-risk states
- Avoid zip codes with insurance instability
- Buy newer homes (post-2010) for better resilience
- Prioritize areas with long-term job growth
- Pay close attention to water availability in desert states
High-Risk Buyer Moves
- Buying waterfront without long-term insurance guarantees
- Overpaying in declining metros
- Investing heavily in short-term rentals

Top 10+ FAQs About the 2025 Real-Estate Risk Map
1. What makes a zip code “doomed”?
A combination of climate exposure, insurance instability, population decline, and economic weakness.
2. Which states have the most at-risk zip codes?
Florida, California, Louisiana, Illinois, New York, and New Jersey.
3. Can insurance issues really collapse home values?
Yes—uninsurable homes can lose 20–60% in value.
4. Which zip codes are safest in 2025?
Mostly inland Southern and Mountain West metros: Tennessee, North Carolina, Texas (inland), Utah, Idaho.
5. Will high-risk zip codes still appreciate?
Some will, but at much slower rates than safer zip codes.
6. Should I sell a home in a declining zip code?
If risks worsen (insurance, disasters, job loss), selling early may preserve equity.
7. Are climate risks overstated?
Not according to FEMA’s updated risk models (2024), which raise projected exposure.
8. What if I want to buy in a high-risk area?
Budget for higher premiums, and confirm long-term insurability.
9. Are Midwest cities safe long-term?
Many are. They offer affordability, low climate risk, and steady demand.
10. Which risks do buyers worry about most?
Insurance increases, climate disasters, and local economic volatility.
11. Can mitigation upgrades reduce my risk?
Yes—roof strengthening, drainage upgrades, and fire-resistant materials help keep homes insurable.
Final Takeaway: Is Your Zip Code in Danger—or Positioned to Thrive?
The 2025 Real-Estate Risk Map shows a nation dividing into climate-risk zones, insurance-stable zones, migration winners, and economic losers. For homeowners and investors, the key is not to watch national trends—but local, zip-code-level forces.
Your zip code may not be doomed. But ignoring the warning signs could be costly. Understanding these patterns now will determine whether you protect your equity—or watch it erode.